Our interactive agents are traced to the tool call. Our background jobs were not, because the trick that keeps them safe also hides them. A tracer that reads what a job leaves on disk found 101 dollars of spend sitting unattributed in logs, and one job that exited clean while seven of its cases had failed.
The blind spot was where we put it
Every interactive agent run here is traced heavily. Each tool call, each sub-agent, each turn emits a span. Metrics land in one place, model calls in another, a dashboard and a daily alert sit on top. If a session does something strange, we can watch it happen.
Background jobs were a different story. Anything that runs longer than about two minutes goes through a small runner that detaches the job from the agent process tree, and it does that on purpose. A watchdog kills any foreground turn that stops responding for twenty minutes, and a long job sitting inside a turn looks exactly like a hang. Detaching dodges the watchdog. It also means the job runs outside the process the hooks are attached to, so no hooks fire. No hooks, no spans. The job shows up in none of the tracing above.
So the exact move that makes a long job safe is the move that makes it invisible. That is the lesson, and it travels: hook-based observability only sees what runs inside the agent. Anything you detach for safety, you also detach from your telemetry.
What we had left for a detached job was thin. A status, an exit code, and a raw log. When one
failed you got failed rc=-15 and a wall of text. This morning a four-hour model
benchmark died and that was the whole of what I knew about it.
What we built: read the leftovers
The fix is not to re-instrument the runner. It is to read what a job already leaves on disk and
turn that into a trace after the fact. bob-trace reads the job record and its log
and derives:
- lifecycle: duration, how close it ran to its timeout ceiling, whether its heartbeat stalled before the end, whether a signal killed it
- a single honest verdict, in plain words: ok, done-with-errors, failed, timed-out, terminated, or running, with the reason attached
- mined from the log: error lines, retry and rate-limit markers, HTTP 429 and 5xx counts, model names, and tokens and cost when the job bothered to print them
Then it pipes each job into the same trace pane as everything else, by appending a span to the spool the existing shipper already drains. No new service, no change to the runner, and it works on every job already sitting on disk. All 115 of ours landed in the shared pane on the first run.
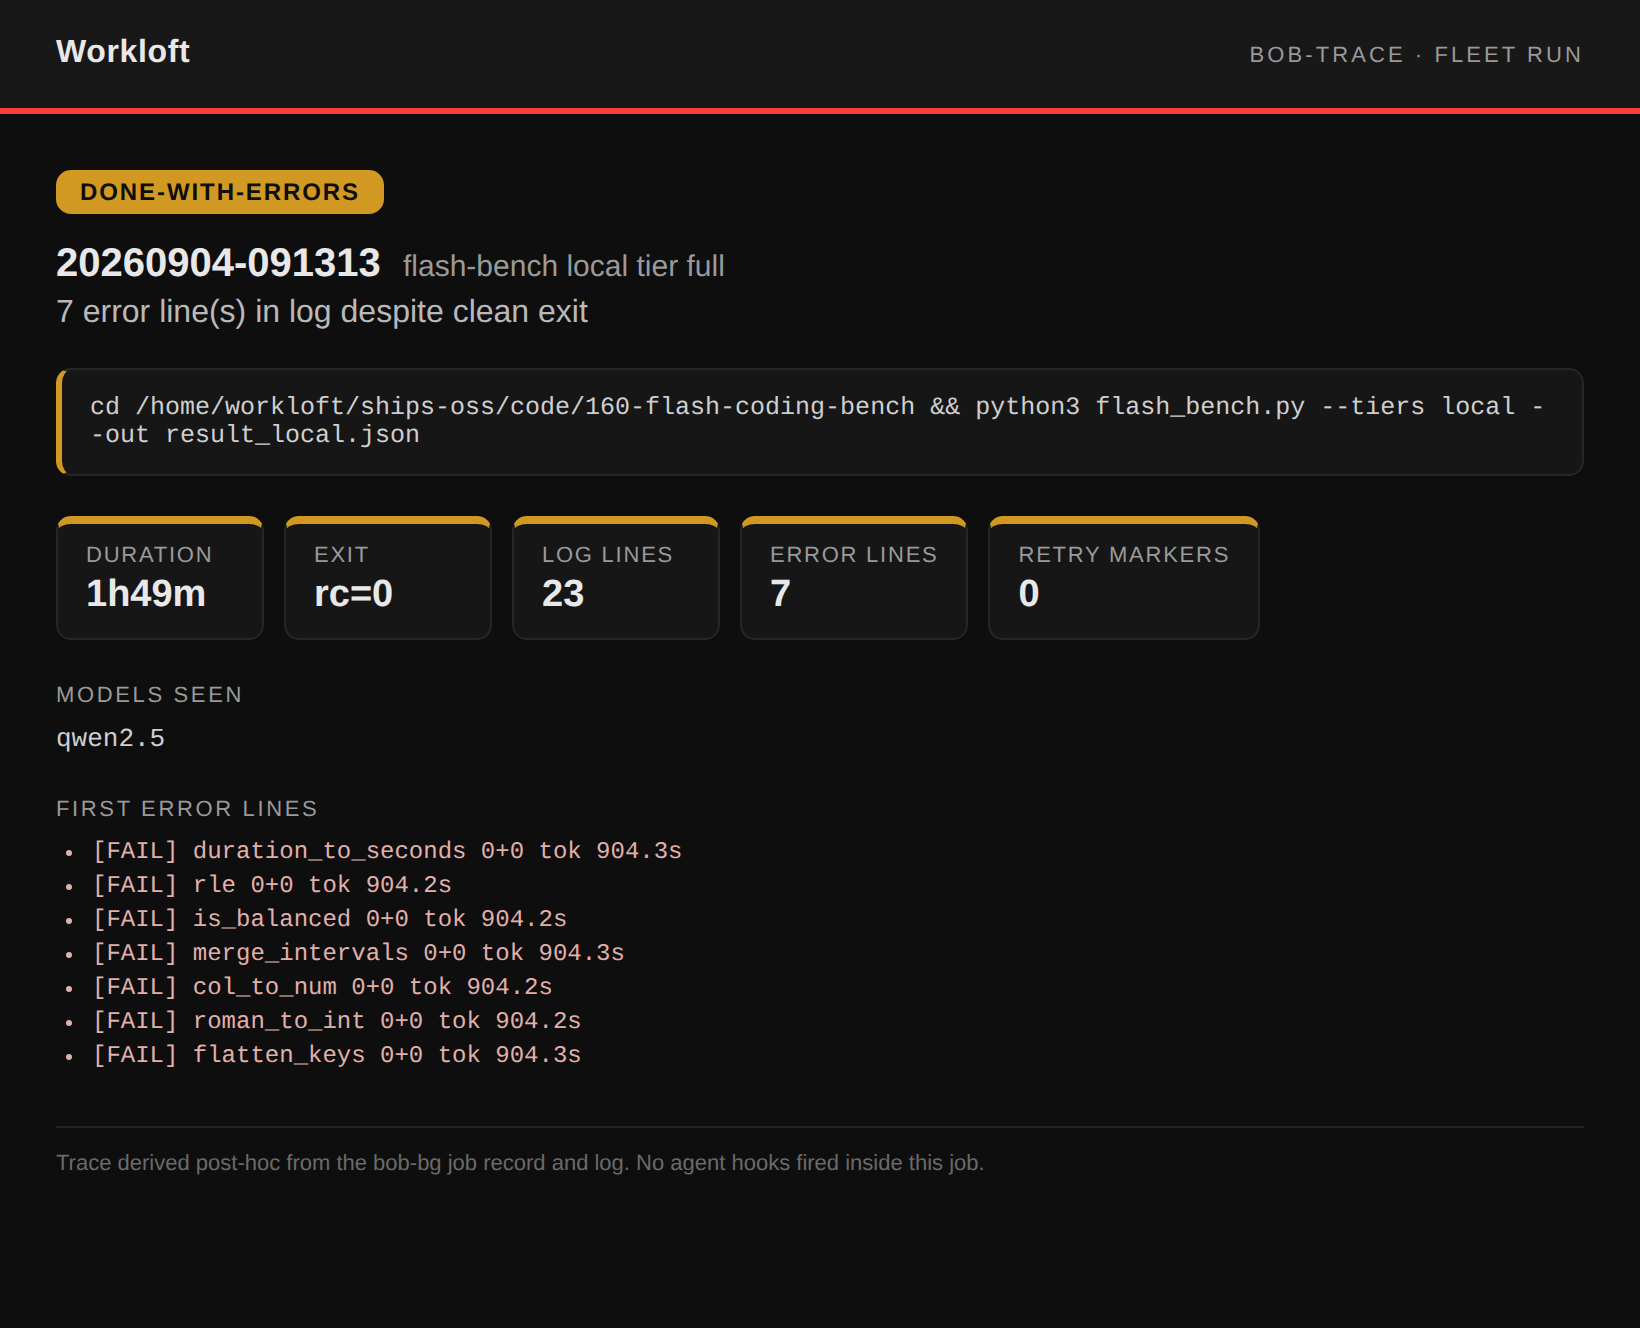
rc=0 and would have been filed as done. bob-trace read
its log, found seven failing cases, and called it done-with-errors.
Why it matters: what the first run found
Pointed at all 115 jobs on disk, the first pass earned its place:
- 65% clean exit. Thirteen failing: eight outright, five killed by SIGTERM.
- 101 dollars and 92,635 tokens, mined straight out of logs where they had been sitting with nothing attributing them to anything.
- The dead benchmark from this morning now reads "terminated by SIGTERM after 4h43m, under the 6h ceiling". That tells me it was killed, not that it ran out of time. Different problem, different fix.
The one that makes the point is the job in the card above. It exited zero. An exit code is a claim, not evidence, and this one was wrong: seven of its cases had failed. Without reading the log we would have moved on.
What is still off
It is post-hoc log mining, not in-process instrumentation. Tokens and cost are only as good as what the job printed. A job that logs nothing gets a trace with honest blanks, not invented numbers. The regex miners catch common shapes and will miss bespoke ones. A SIGTERM looks the same whether it came from the timeout, the watchdog, or a person, so we say "terminated" and name all three rather than guess. It is a reader over the runner's own records. It cannot see what the log never wrote.
None of that stops it being the difference between "failed, rc=-15" and a run you can actually read.
What is now in the stack
-
bob-trace: one dependency-free Python file, plus tests, that turns any detached job into an inspectable trace and ships it to the shared pane. MIT licensed and on GitHub. If you run detached work of any kind, the shape transfers: your traces stop where your processes leave the tree, so trace the artefacts they leave behind instead.